← Work
Growth ExperimentationOnboardingAgile Operating Model 2023 - 2024

What We Built When We Could Not Build Much

A two-week data-driven cycle that let a small squad disprove its own ideas

Role Product & Project Lead
Market Taiwan; new-user onboarding
What We Built When We Could Not Build Much
01

A Wave We Could Track

KKBOX needed subscriber growth in Taiwan, and the team had already spent whole projects going after it from the familiar directions. Reduce churn among existing users. Win back the ones who had left. Both moved slowly, and neither moved much.

Then a telecom partnership put KKBOX inside a carrier's subscription package, and new registrations started arriving in volume from a single, clearly defined channel. We knew exactly when they arrived, through which plan, and what they did next. For a team that had been trying to read small movements in a large existing user base, a clean incoming cohort was the most measurable thing anyone had been handed in years.

These users also had a property worth building for. They had not compared streaming apps or read a review. KKBOX came with the phone plan. That meant their first session carried unusual weight: nothing before it had given them a reason to stay, so everything depended on what happened inside it.

Two opportunities sat on top of each other. A real chance to move the subscription number, and a well-defined population to test a new way of working against.

So we built a small cross-functional squad and gave it one job: run a full loop every two weeks. Propose, evaluate, build, validate, iterate. We called it KKBOX Cycle.

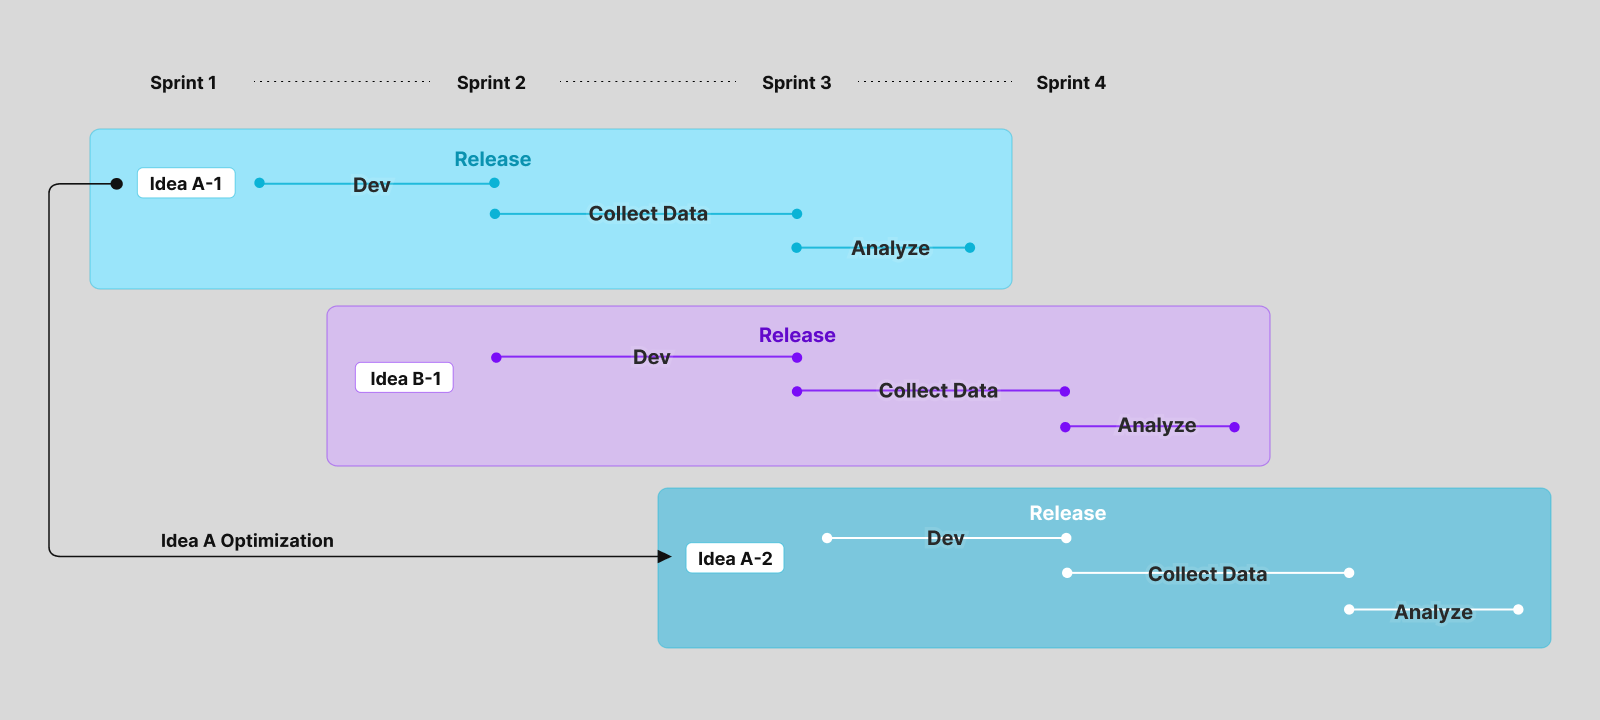
The loop worked because the lanes overlapped. While one idea was collecting data, the next was already in development, and the analysis from the first fed an optimization rather than blocking the queue.

So the first work was choosing.
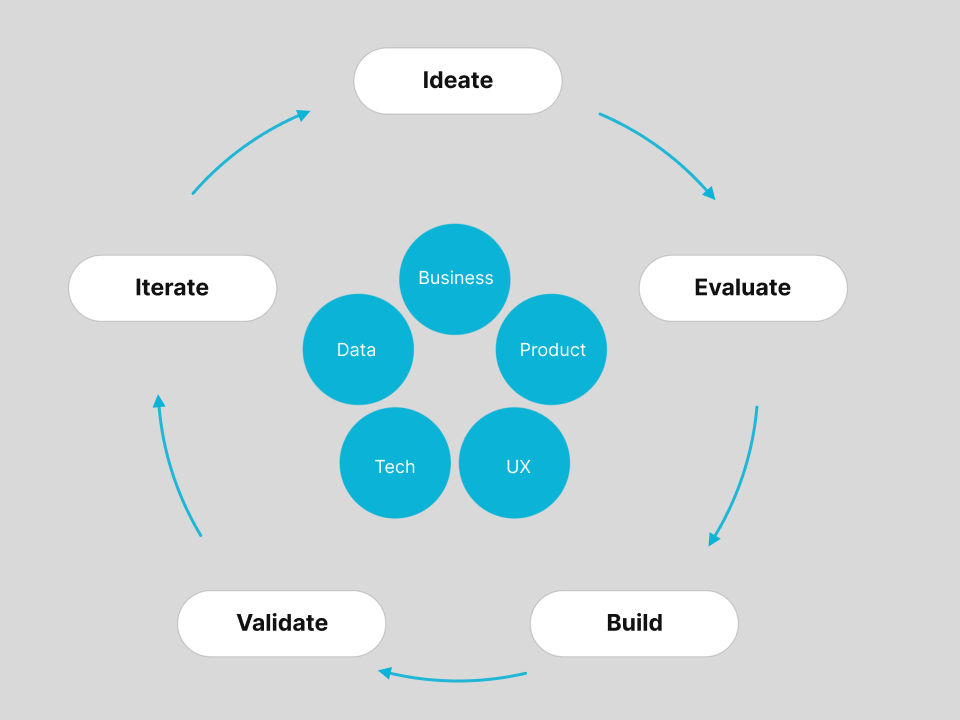
Squad diagram showing six to eight people across product, engineering, UX, business, and data, circling a loop of ideate, evaluate, build, validate, iterate
Six to eight people, five functions, one squad. Six ideas, one per sprint.
Lane graph showing experiment ideas running in overlapping two-week lanes, with analysis from one lane feeding the next
Ideas ran in overlapping lanes. Analysis from one fed the next round rather than stalling it.
02

Choosing the Battle

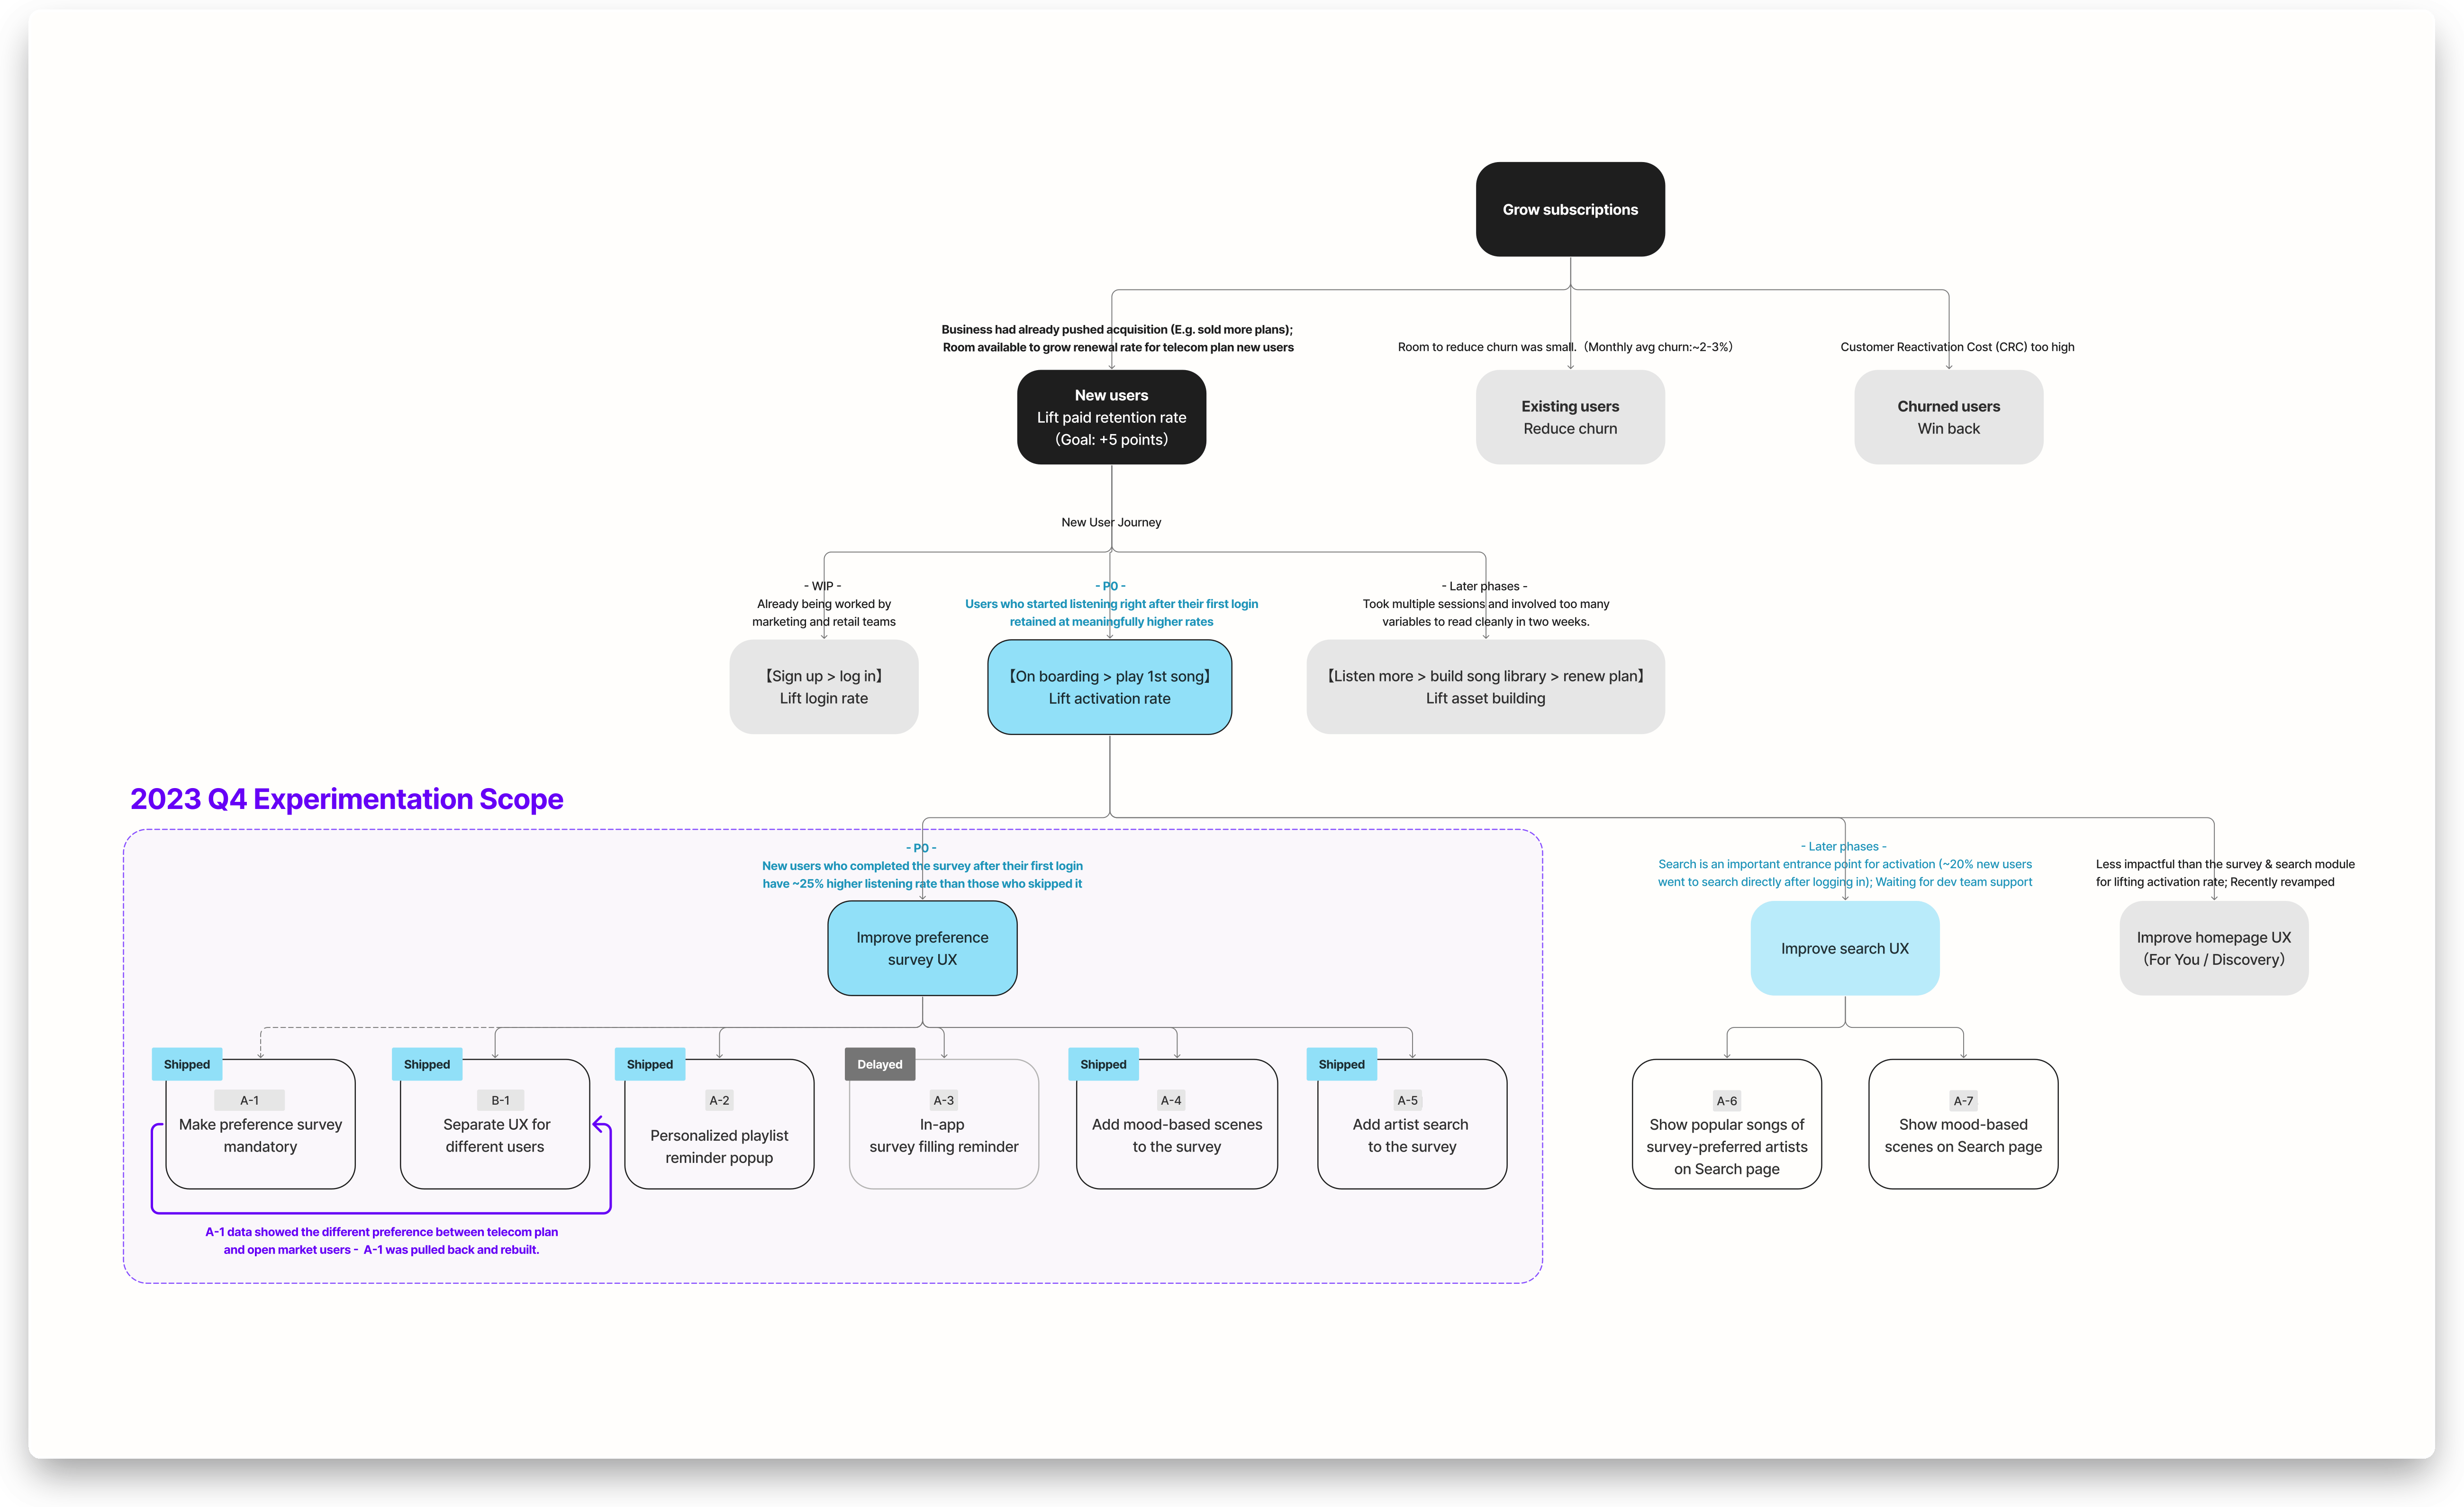
I worked with our BI analyst to build a decision tree to find the best leverage. It made three cuts in order: which metric actually moves subscriptions, which user segment has room to move it, and which step of their journey carries the most leverage.

Decision tree running from the subscription goal down to the ideas that came out of it, with two branches ruled out on data
The full tree, from the subscription goal down to the ideas that came out of it. Two branches were ruled out on data before any ticket was written.

User target: new users

Three candidates sat under the metric question. Win back users who had already left. Reduce churn among existing users. Or convert the new registrations now arriving through the carrier. Existing-user churn was already stable and low, so the ceiling on improving it was small. Win-back cost too much per recovered user to justify a quarter of squad time. The new arrivals were the only branch where the same effort could still change the number.

Journey target: activation

Then we cut the same way one level down, along the new user's journey: sign up, log in, state their preference, play a first song, play more songs, build a library, renew the plan.

Login was already being worked by marketing and retail. Library-building took multiple sessions and involved too many variables to read cleanly in two weeks. The first song sat in the middle, inside a single session, and it belonged to the product.

What makes a user convert

The data made the case. Users who started listening right after their first login retained at meaningfully higher rates. And new users who completed the onboarding preference survey after their first login started listening at rates about 25% higher than those who skipped it.

Every experiment for the rest of the quarter targeted one moment: the first session. The target we set at kickoff: lift paid retention among new registrants by 5 points.

03

Five Ideas in One Quarter

How the Cycle Ran

Nothing shipped as a feature. Everything shipped as an experiment, which meant two rules did most of the work.

Anything we picked had to ship inside two weeks, release included. That constraint chose the ideas for us. Tooltips, prompts, a card placement, one new step in a flow. Nothing that needed a quarter of backend work survived contact with it.

Every idea carried a written hypothesis, its success metrics, and a counter-metric, all agreed before anyone built it. The counter-metric was the part that mattered. We named in advance what would tell us the idea was doing damage, so nobody could reinterpret a bad result afterward.

Tripping a counter-metric did not automatically kill an idea. The rule was: observe the data, check whether a fix exists, then decide whether to continue. The point was to make the decision deliberate rather than optional.

Then every idea hit the same gate. Once it was live and the data was in, BI and I read the result together and made one call: worth another round, or close it.

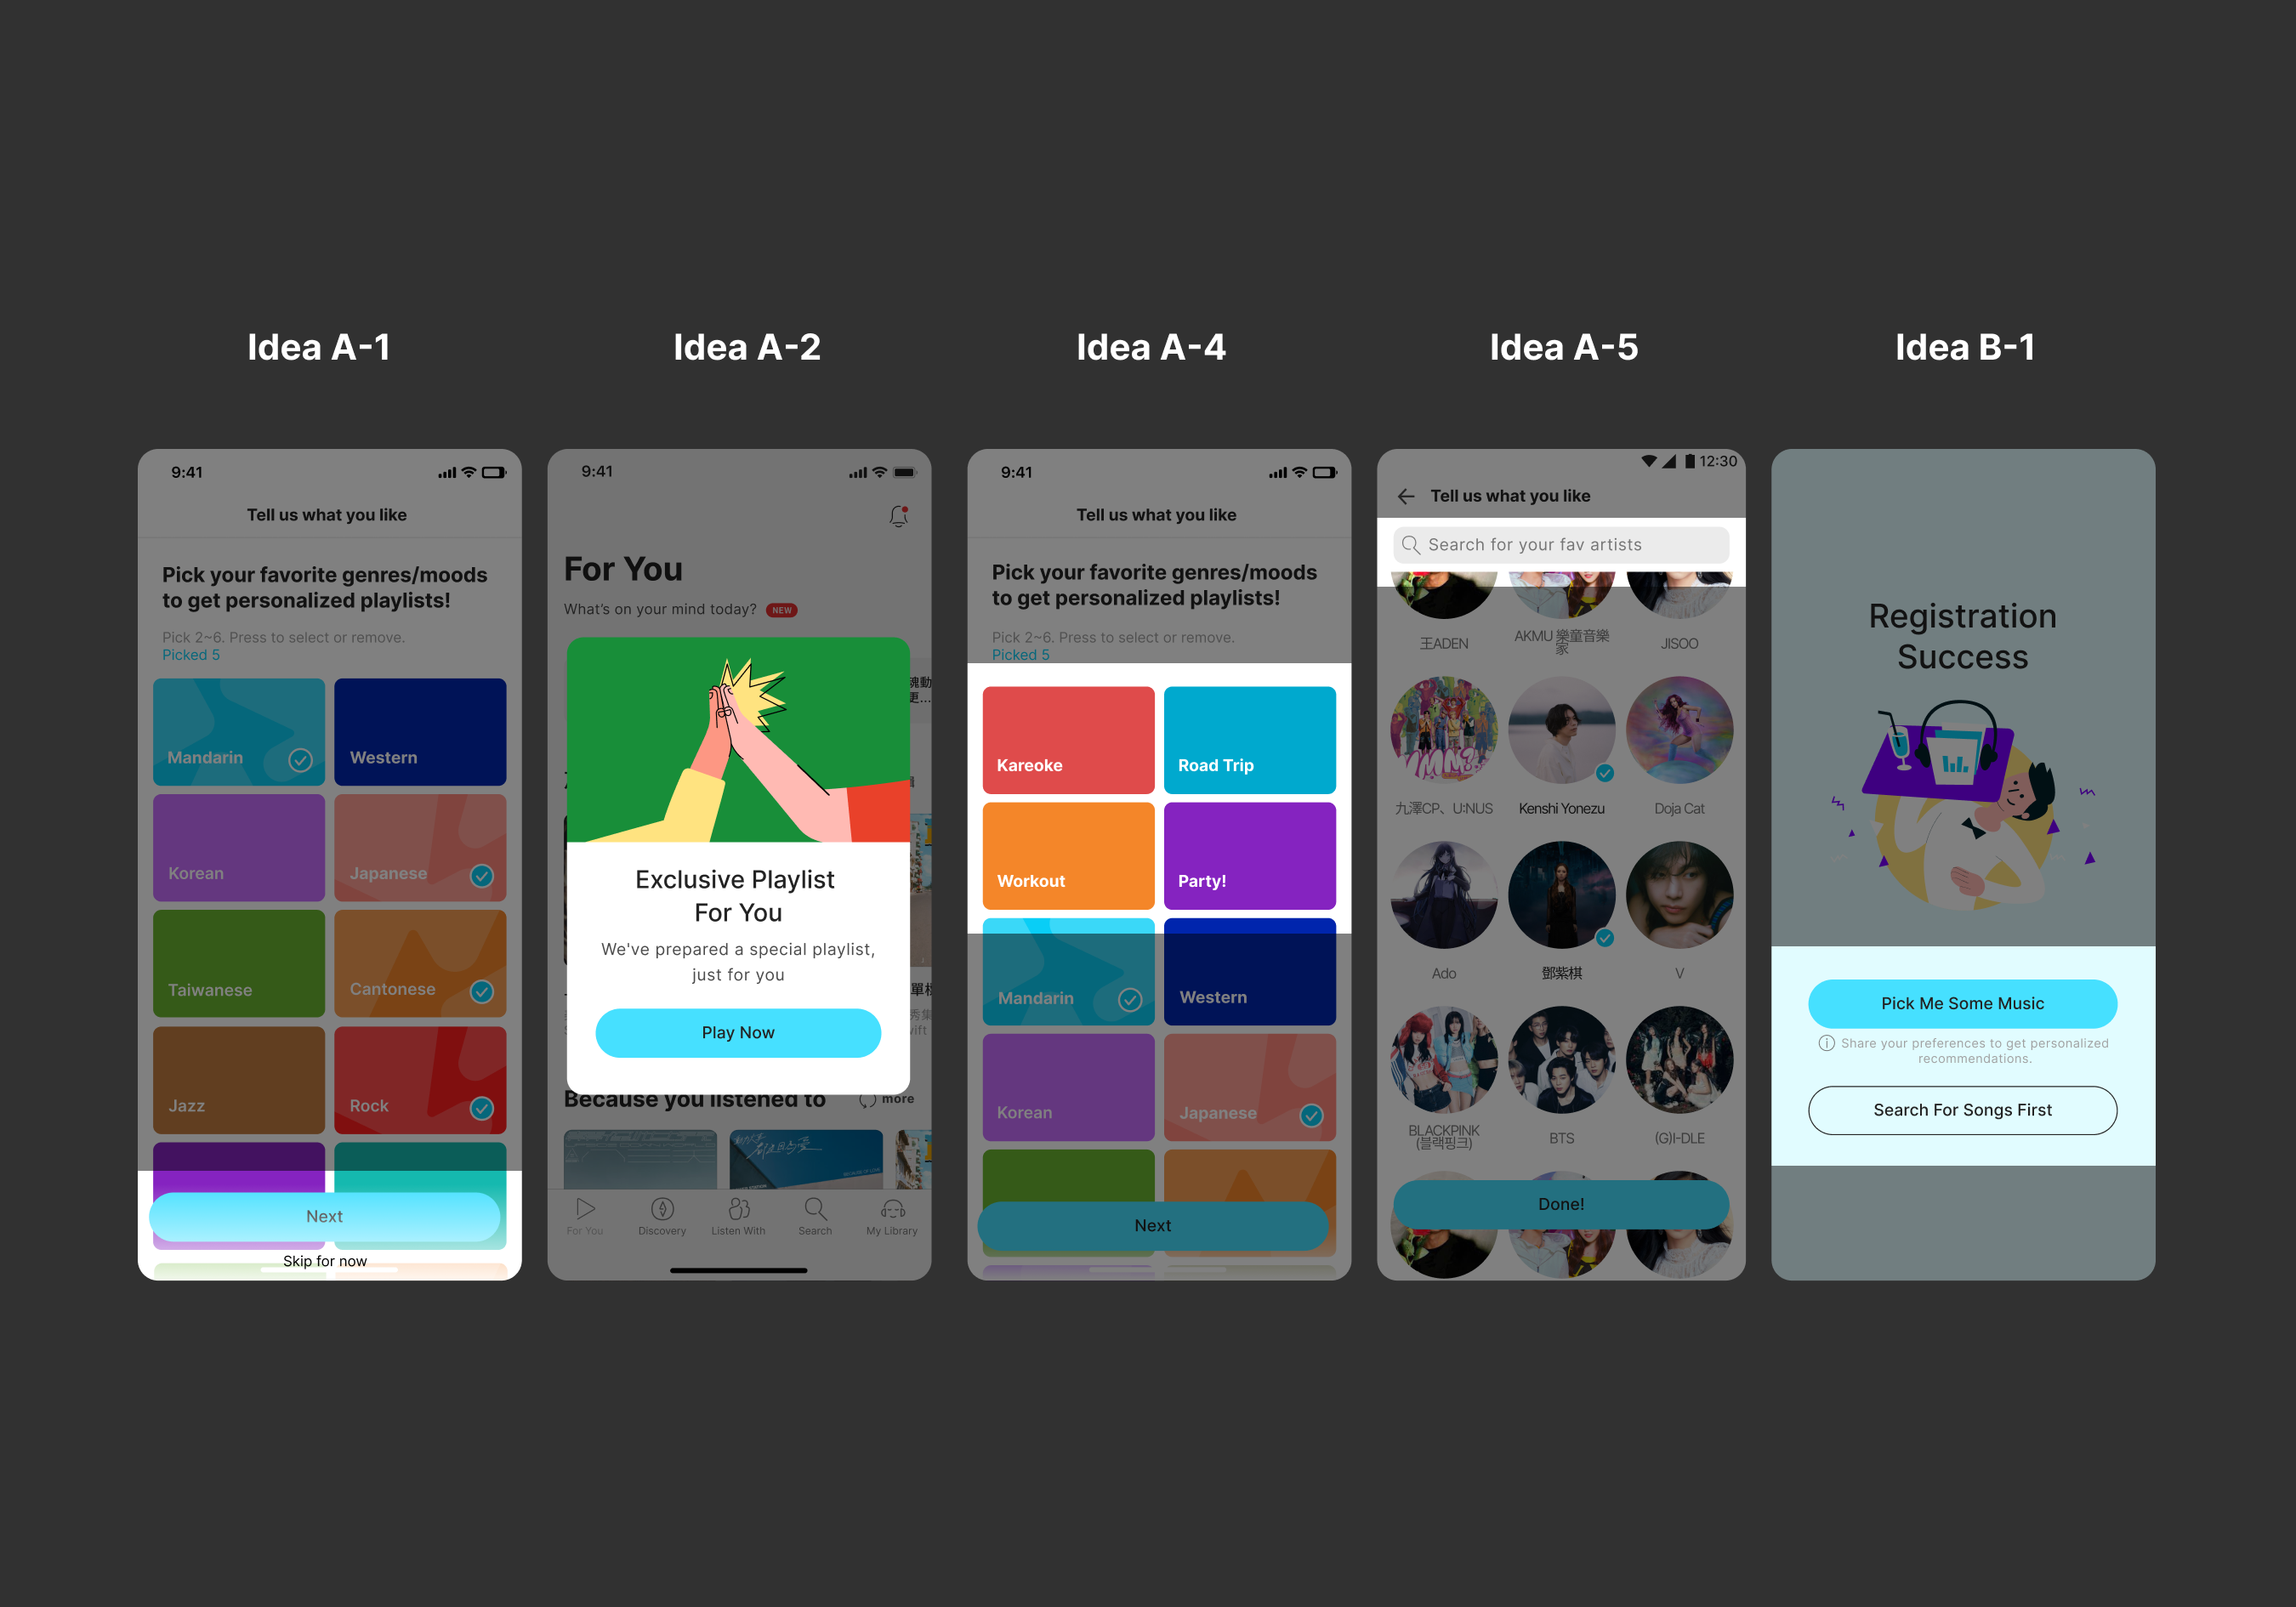
Five ideas shipped in three months: removing the skip button from the preference survey, a popup confirming the personalized playlist was ready, mood-based scenes added to the survey, artist search inside the survey, and intent routing at the end of registration.

The last one had already been shelved once. We pulled it back and rebuilt it after the first release came back with results showing a segment we had not accounted for.

The five shipped experiments shown in the order they were released
The five that shipped, in the order they went out.

One Idea, Followed All the Way

TUWYL, Tell Us What You Like, is the step where a new user picks genres and artists. It exists so KKBOX can personalize before there is any listening history to personalize from.

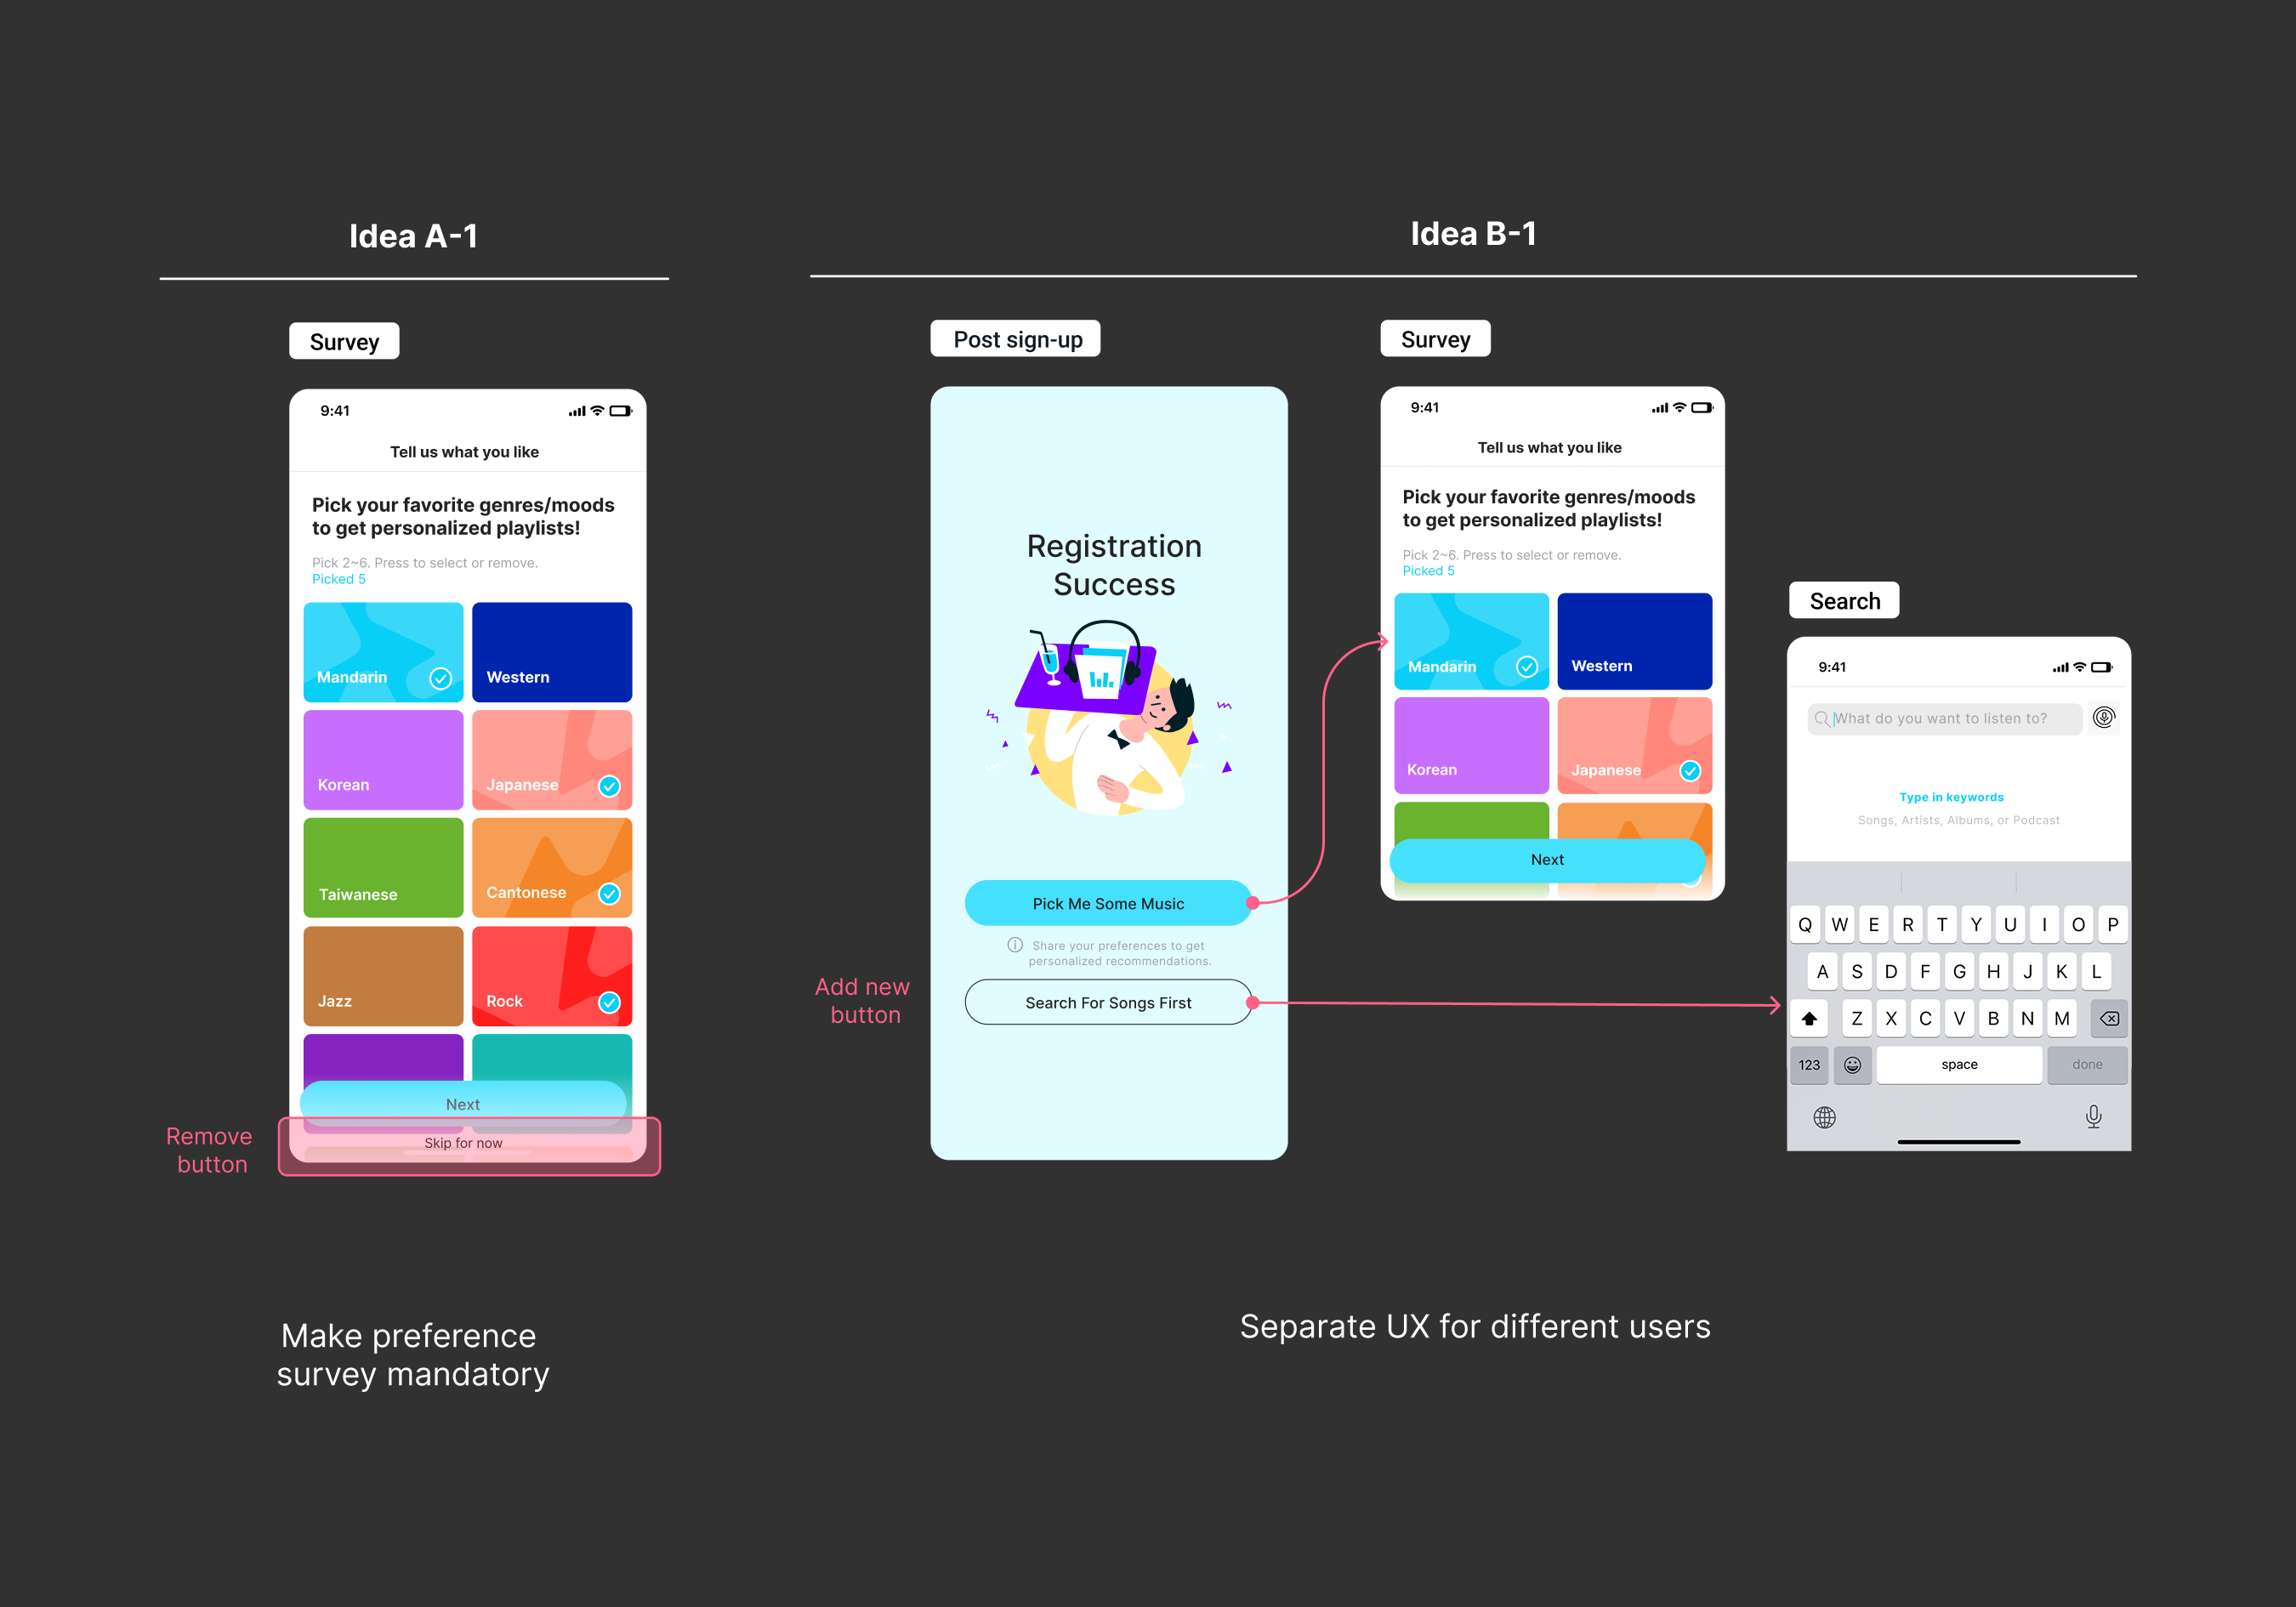
That 25% gap was correlation, not proof. Users who chose to fill in the survey may simply have been the users who were already going to listen. So we tested the obvious move. We removed the skip button and made it mandatory in the first-login flow.

For the telecom cohort, it worked. Comparing the quarter after launch against the same cohort a quarter earlier, the share of logged-in users who went on to play music rose about 20%, and the survey became their most common source for that first song. These users had arrived without a reason to explore. Handing them a playlist built from their own answers gave them one.

For open-market users, running in parallel, almost nothing moved. The completion rate went up, as designed. The activation rate did not follow. These users had chosen KKBOX. They had a song in mind before they finished signing up, and an extra step between them and it was friction, not help.

The finding sat one level above the feature. The same step carries different weight depending on how someone arrived, and a single onboarding flow was quietly optimizing for the wrong one of them.

So we split it. The survey stayed mandatory for telecom arrivals. Open-market users got a choice at the end of registration: personalize now, or go straight to search.

The mandatory preference survey and the optional intent routing screen shown side by side
Same step, two doors. Mandatory for users who arrived passively, optional for users who came looking for something.
04

What Actually Scaled

The quarter produced two kinds of result.

The metrics moved. Activation and paid retention both cleared the targets we set at kickoff, inside a single quarter, from a squad of six to eight people.

The method outlasted the quarter. After the trial round, senior management expanded the Cycle beyond our squad and adopted it as the operating model for other initiatives across the company.

+20% New user activation Share of logged-in telecom-plan users who played music, Q4 vs Q2
+6.2 points Paid retention Beat the 5-point goal set at kickoff
5 of 6 ideas Features shipped One per two-week sprint, each measured, then closed or iterated
Adopted company-wide Operating model Cycle expanded to other initiatives after the trial round